An introductory tutorial for Deer Valley HS Students
and users of Conceptual Astronomy
Jeff Adkins
Here is the tutorial in iBooks format: GREEAT Science
Here is the tutorial in pdf format: GREEAT Science
Below is the unformatted tutorial in HTML.
Version 3, August, 2014
This page is intended as an introductory-level tutorial on how the major intellectual tools of science connect together to allow us to figure out how the world works. For more advanced treatments of any individual topic, please consult your textbook or instructor. If you're looking for a quick summary or a reminder on a particular relationship, jump to the master summary at the bottom of the page.
The Nature of Science
Science is based on doubt.
Removing doubt is what all the work of science is for. Without the removal of doubt, you can't be sure how anything works.
In science, people make observations of things. If enough people make enough observations, we accept these observations as "facts". Facts are just observations where everyone agrees on what they're seeing. They don't really need to be proven or disproven; they may need to be explained with a theory or confirmed with an experiment, but only theories and hypotheses get proven (or rather, not disproven).
It's technically impossible, contend most scientists, to "prove" anything; to do so assumes you have ultimate knowledge about all physical laws, known and unknown. Since no one can do that, most legitimate scientists settle for being "thoroughly convinced" instead of "absolutely proven." If you fly on a plane, you are doing so on the assumption that all the science and engineering that makes the plane fly will keep you up in the air. You're convinced--and bet your life on--the concept that flying works.
Facts are organized into patterns and used to make predictions about observations we haven't made yet. These predictions are called hypotheses. The purpose of an experiment is to test to see whether or not a hypothesis is true.
Once a hypothesis is supported by an experiment, or a series of experiments, an explanation is attempted which is supposed to show why the hypothesis is true. Any good theory, then, explains the results of past experiments, predicts the results of future ones (by generating testable hypotheses) and (here's the part many people overlook) doesn't contradict any known, working scientific law.
A scientific law is nothing more than a very old, trusted theory.
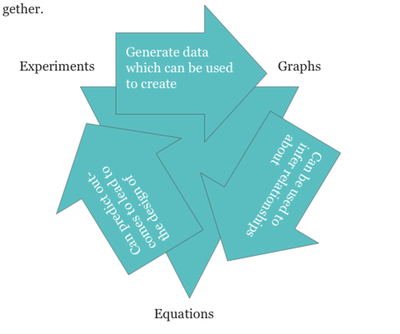
Conceptual Tools for the Scientist
Scientists use three main conceptual tools to understand how the world works. These are graphs, equations, and experiments. These three things fit together and support each other exceptionally well. A graph can be used to predict the outcome of an experiment; an equation can be used to design an experiment; an experiment's result can generate a graph.
The whole point of recognizing a relationship in an equation is to learn how to predict how its graph will look, and to learn how changing one variable affects another variable. That is, after all, the whole point of experiments. It's also true that if you see a graph with a shape you recognize, you can predict how the equation will look.
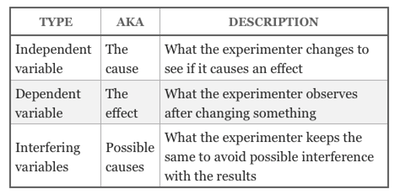
This table shows how all the major experimental design components, graph types, and equation styles fit together.
You can read about each of these components in detail below, or you can skip directly to the master summary which gives a lot of information in a small space.
Experimental Design
The purpose of an experiment is to answer the question: "How do you know?" by using the answer "Because I've tried it."
More specifically, in science we believe that a convincing answer has the following characteristics:
• If you have any doubts, you can try it for yourself.
• More examples are more convincing than fewer examples.
• Simpler experiments are easier to understand and more trustworthy.
• If you change more than one thing at a time, you won't know what caused the effect.
To meet these criteria, any good experiment must follow the same basic format. This is sometimes referred to as "the scientific method," but that is not as rigid a concept as many books (or this web page) would have you believe. Consider this quotation:
"Ask a scientist what he conceives the scientific method to be and he adopts an expression that is at once solemn and shifty-eyed: solemn, because he feels he ought to declare an opinion; shifty-eyed because he is wondering how to conceal the fact that he has no opinion to declare." - Sir Peter Medawar (source).
That said,
In a good experiment, you change one thing, watch one thing, and keep the rest the same.
For example, let's suppose you wanted to improve the recipe for baking a cake. Each time you bake a cake you could try a different recipe; for example, the first time you bake a cake you could use this recipe, which comes from www.recipe.com.
Butter Cake

A basic recipe that serves as the basis for many desserts.
- Cooking spray (optional)
- 1/2 pound (2 sticks) unsalted butter
- 1 1/2 cups sugar
- 3 eggs, slightly beaten
- 2 teaspoons vanilla extract
- 2 1/2 cups flour, sifted, or 3 cups cake flour (omit the cornstarch if using cake flour)
- 1/4 cup cornstarch (if using all-purpose flour)
- 1 tablespoon baking powder
- 1/4 teaspoon salt
- 1 cup milk
Preheat the oven to 350 degrees F. Butter or spray two 8- or 9-inch cake pans, 24 muffin tins, or one 9- x 13-inch cake pan and coat each pan with 1 teaspoon of flour. Using an electric mixer, cream the butter and incorporate the sugar, beating slowly for 2 minutes until smooth. Add the eggs and the vanilla extract and beat 2 minutes more. Combine the flour, cornstarch (if using), baking powder, and salt in a 2-quart mixing bowl. Starting and ending with the flour, alternate flour and milk additions, scraping down the sides of the mixing bowl two or three times, until the batter is smooth. Spread the batter evenly in the prepared cake pans. Bake about 30 to 35 minutes, until golden on top and springy to the touch; a toothpick inserted in the middle should come out clean. Don't overbake. Bake cupcakes about 20 minutes. Allow the layers to cool 10 minutes in their pans, then tap along the edges to loosen. Nudge the layers out of their pans onto wax paper so the bottoms cool before you ice them. When you are ready to ice, tear wax paper into strips to tuck under the cake edges to protect the serving plate. Choose any favorite icing; they all go with this cake.
Makes two 8- or 9-inch rounds, 24 cupcakes, or one 9- x 13-inch sheet cake
Source: www.recipe.com
Now let's suppose you make this cake, and, with apologies to www.recipe.com, it turns out too dry. What could you do to make the cake moister? Well, you could
- Add more eggs
- Add more milk
- Don't bake quite so long
- Add more butter (which melts)
- Use less flour
- Bake at a lower temperature
Now, if you did all these things at once, it would be hard to predict what might happen to the cake's flavor. It might be moister, but it might also taste bad; it might be so moist it doesn't finish baking; it might be too moist and soggy; or it might be just what you're looking for. However, if you're a professional chef, you couldn't afford to waste the time (and ingredients) on such a hit-or-miss approach to improving the recipe. You'd want to do it systematically, so that you could tell what thing you did made the cake taste better. That means you'd want to pick just one thing, and change that, like for example, the milk:
1 1/2 cups milk
or maybe
1 3/4 cups milk
or even
2 cups milk
In this way, by only changing one thing, the risk of ruining the cake (and not being able to eat it is lessened, yet you still gain the information needed to improve the cake.
So let's review. In this mini-experiment you changed one thing (the milk) watched one thing (the moistness) and kept the rest the same (baking time, baking temperature, butter, eggs, and everything else). If the experiment works, you could say that the amount of milk causes the moistness to change.
The structure of a basic experiment
In more formal scientific terms, we say we change the independent variable, watch the dependent variable, and keep the interfering variables the same, so they won't interfere. What do these big words mean? A variable is a thing which can be measured. They're simply labels for the very easy ideas we've already discussed.
The interfering variables are hard for some students to understand. Just remember the cake example: if you change the milk and the eggs, you won't know which thing made the cake moister. So change the milk, and leave the eggs alone. If you don't the eggs will interfere in the results. Get it?
Definition of a hypothesis
In the cake-baking example, the experimenter wanted to know if changing the milk caused the moistness to change. We call this a hypothesis. You can test to see whether or not it works. The hypothesis is a question the experiment is designed to answer. It must contain the independent and dependent variables at least (the interfering variables are assumed to be under control). It usually has the form of a prediction based on past experience. So, for the cake-baking example, the hypothesis is:
Increasing the amount of milk will probably make the cake moister.
Notice the independent variable (amount of milk) and the dependent variable (cake moistness) are both mentioned.
A generic hypothesis usually has the form:
This change in the independent variable will make the dependent variable do that.
Examples
Let's look at some examples of experiment hypotheses (plural of hypothesis).
Example 1.
A student investigating electrical circuits changes the voltage on a resistor to see the current gets larger or smaller.
To reveal the answers highlight the spaces after the colon.
Independent variable: voltage
Dependent variable : current
Interfering variable : resistance of the resistor is the only one mentioned. There may be others, such as the temperature of the resistor or the kind of wire used to connect it.
Example 2.
A student reads the correct horoscope from the right day to a group of people and asks them if they think it applies to them. Later, the student reads the wrong horoscope from the wrong day to a different group of people and asks them the same question. The student is trying to find out if people can tell the difference between the right and wrong horoscopes, and infer from that whether or not astrology actually works.
Independent variable: whether or not you read the right horoscope to a person.
Dependent variable: what they say in answer to the question: Does this apply to you?
Interfering variable: The only one that is mentioned is what question you ask ("asks them the same question"). There are many others, for example, how you read the question (giving away the secret), who you ask, whether or not you know the horoscope is right and unconciously reveal it, and so on.
This experiment would be a good case for using the "double-blind" design, where the experimenter doesn't know if they are reading the right horoscope or not. To improve the design, the experimenter would have to have a 3rd person, probably an assistant, scramble the horoscopes so that the experimenter wouldn't know whether or not the correct horoscope was being read to the subject. In that way the experimenter's prejudices wouldn't interfere. When the results are done, the assistant unscrambles the results and sorts them according to the independent variable.
See if you can predict the independent, dependent, and interfering variables for these sample experiments.
Example 3.
A student increases the force on a rolling cart to see how its acceleration changes.
To reveal the answers highlight the spaces after the colon.
Independent variable: Force on the cart
Dependent variable: Acceleration of the cart
Interfering variables:
The mass of the cart is the only one mentioned .
The surface used is another.
The friction in the carts' wheels is another.
Example 4.A student moves a light sensor farther away from a light bulb to see if the brightness of the bulb changes.
Independent variable.
Distance from bulb to sensor
Dependent variable:
The brightness of the bulb, as measured with the sensor.
Interfering variables:
None are directly mentioned.
The voltage used to light the bulb must be constant.
The room lights must be off.
If a computer is used its screen must be dimmed and turned
away.
If the surroundings are black instead of white there will
be less reflected light.
The sensor should not be too close to the light bulb or
it won't look like a point source.
Designing an experiment
With those results in hand, it is now time to try designing an experiment of your own. Click on the pop-up menus below to design your own experiment.
The purpose of this experiment is to study the motion of an object; say, a car driving on a little trip. Pick a variable for each blank presented and remember, you can only use a variable ONCE.
In my experiment, I am going to investigate the effect of changing the
Independent variable
speed of the car
distance the car travels
time it takes to get there
on the
dependent variable
speed of the car
distance the car travels
time it takes to get there
, while keeping the
interfering variable
speed of the car
distance the car travels
time it takes to get there
constant.
Shared Example for experimental design
Suppose an experimenter used the following hypothesis:
The longer I let a rock fall, the farther it will fall. In fact, it will fall four times farther if I let it fall twice as long, exhibiting a special relationship between time and distance.
In this experiment, the independent variable is time. The experimenter CHOOSES to select the time when the measurements will be made; so in some sense the experimenter is controlling time. They could do this by filming the rock falling, for example, and only examining every 60th picture so that information is gathered for each second, ignoring the other 59 pictures made along the way.
Therefore the dependent variable is distance. The experimenter measures this as a result of the time he or she chose to observe.
There are any number of interfering variables such as air resistance, the shape of the rock, and where the experiment is conducted (on earth or some other planet). These things must be eliminated by using a heavy rock, using a smooth symmetrical rock (not lumpy) and doing the experiment in the same place.
To see some sample data and graphs for such an experiment, click here.
To see the equation for an object which falls and how to analyze it, click here.
Connections
Once you have your results, it's traditional to graph them (if numbers) or display them in a table (if words). Traditionally, you present a data table with the independent and dependent data, and a graph with the independent variable on the x-axis and the dependent variable on the y-axis. These topics are covered elsewhere on this page. Once you have a graph, you can analyze it to see if there is a specific relationship between the two variables. If you're lucky you can even infer or derive an equation which allows you to make further predictions.
Advanced tips
Here are a few tips for designing your own experiments:
• More data is always better. Not only should you have several different values for the independent variable, you should repeat each one several times. Accuracy of experimental results is an entire topic unto itself.
• If you want to find out the effect of changing more than one variable at a time, you can do a series of experiments called a multi-dimensional experiment where you do one whole experiment by changing the independent variable, then do another experiment by changing a different independent variable, and so on. Often 3-d graphs are used to display such results.
• A variable is a thing that can be measured, not a thing. Think of a variable as an adjective, not a noun. So don't list "car" as the independent variable; list "speed of the car", or "weight of the car" or "color of the car" or "year of manufacture".
Graph Analysis
This section is not intended as a replacement for learning how to make a graph. Rather, its function is to show how to analyze a graph you have already made to find out what kind of relationship exists in it.
By tradition, when you have completed an experiment, you typically plot the results on a grid with the independent variable on the x-axis, and the dependent variable on the y-axis.
A good graph has what is being measured written on each axis, along with the unit of measurement. In the language of experimental design, this is called a "Dependent versus Independent" graph.
Any time you see the word "versus" describing a graph, the words before "versus" go on the y-axis, and the words after "versus" go on the x-axis. Incidentally, this is very difficult to control on a spreadsheet unless you set your columns up correctly: y is the left column, x is the right column, and use "X-Y Scatterplot" style graphing.
Also, the data is displayed in a table with the independent variable on the left column, and the dependent variable on the right. This is because the independent variable is changed first, and happens first, and so it comes before the dependent variable, which happens later.
Graph shapes
Many graphs have a similar shape, and can be classified according to how they appear. The classifications describe what the shape looks like, and also provide clues about the relationships between the variables involved.
In high school science (up to 12th grade), graphs almost always can fit into one of the following shape categories:
• linear
• radical
• inverse
Combinations of these shapes can occur. The most common is a combination of inverse and quadratic called "inverse-r-squared" for reasons better explained elsewhere. Advanced classes may see two other kinds of graphs:
• logarithmic/exponential
• sinusoidal
In this document we will concentrate mainly on the four basic shapes; and while such combinations as "linearly quadratic" and "radical inverse" exist, we will pursue only examples you're likely to see in introductory science classes.
What the graphs look like
Linear
Linear graphs are straight lines, such as this graph used to find the density of a rock: The graphs of linear functions are said to have direct relationships. This means that whatever change happens to x, a proportional change exactly the same scale happens to y.
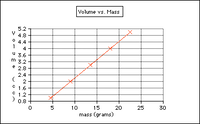
In this example, what is the mass of a 2 cc rock sample?
Click here!
9 grams
What is the mass of a 4 cc rock sample?
Click here!
18 grams
So you can see, for a linear graph, choosing an x- value twice as large makes the y-value twice as large as well.
In this experimental design, the experimenter changed the mass of the sample being looked at, and measured the resulting volume. Thus mass is independent, and volume is dependent.
Inverse
Inverse graphs are characterized by a "downhill slope" appearance because they represent relationships that make one thing larger as another thing gets smaller. In this example, a person drives the same trip over and over at various speeds. The person discovers, naturally enough, if you drive faster, it takes less time to get to your destination.
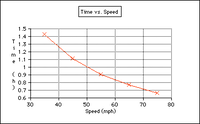
In an inverse graph, you can see that larger values of x lead to smaller values of y. In fact, going twice as fast should get you there in half the time. Compare 35 miles per hour to 70 miles per hour. At 35 miles per hour it takes about 1.45 hours to make the trip (50 miles in this case). At 70 miles per hour it takes about 0.73 hours, or half the amount of time.
In this experimental design, the speed was changed by the experimenter (so it is independent) resulting in different times for the trip (so time is dependent).
Quadratic
Quadratic relationships happen when one variable is quadratically related to another. This occurs when one of the variables is squared to obtain the other variable. In this example, the diameter of a pizza is compared to the area of the pizza.
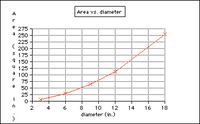
Look at the area of a pizza which is 6 inches in diameter. About how much is it?
Click here!
About 28 square inches.
Now look at the area for a pizza with twice the diameter , or 12 inches. How much area does it have?
Click here!
About 113 square inches, which is 4 times larger.
So in a quadratic relationship, doubling the x-axis value causes the other value to increase four times. For more information about how quadratic relationships work, click here.
Radical
In a radical graph, the shape appears to go uphill at first, but then gradually flattens out. In this example, the time needed for a rock to fall a specified distance is measured.
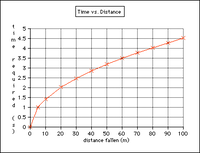
In these relationships we find the dependent variable (time in this case) by taking the square root of the independent variable (distance fallen). (There are other factors involved; for an analysis of the equation that generates this graph, click here.) In other words, time is a function of the square root of distance in this example.
![]()
In these kind of relationships, it is often more convenient to swap the x- and y- axes and rewrite the relationship as a variation of a quadratic relationship. You can see by looking at this graph if we swap the axes we get a graph that looks like this:
Which is the graph for the equation
![]()
which has a quadratic relationship. So radical graphs are the same as quadratic graphs with the axes flipped. This is a graphical way of saying the mathematical rule:
To get rid of a square root in an equation all you do is square both sides.
Inversely Quadratic or Inverse-r-squared graphs.
Inverse-r-squared graphs refer to an important category of phenomena such as the strength of the force of gravity, the brightness of light, and other effects, which obey a relationship which is inverse at the same time it is quadratic. For more information about the mathematical relationship, click here.
Inverse-r-squared graphs look like inverse graphs, but they just "scoop out deeper." as shown here.
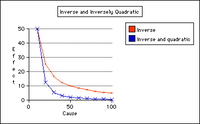
As with gravity, for example, the farther away you get the weaker the effect gets. If the relationship is inverse, if you get twice as far away, the effect is half as strong; but with inversely quadratic, if you get twice as far away, the effect is only one-quarter as strong. Click here for an example of an equation that behaves this way.
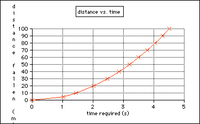
Shared Example for Graphs
Here is a data table a student used in an experiment about a falling object:
time (sec)
distance (m)
0
0
1
5
2
20
3
45
4
80
5
125
In this experiment time was independent (the experimenter decided how long to let the rock fall) and distance was dependent (the experimenter observed the distance the rock falls as a result.)
The graph the student generated from this data looks like this:
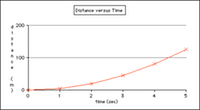
This graph has a
Click here!
Quadratic
shape.
To learn about the experimental design used to get this data, click here.
To learn about the equation that describes this data, click here.
Common Errors in Graphing
Students sometimes just copy the data onto the axes like this:
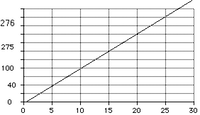
• This doesn't work because the y-axis values are not equally spaced. There should be the same size gap between each tick mark on the side of the graph, as in 40,80,120,160,200,240,280 as opposed to 0,40,10,275,276 as shown here. This type of error always causes the graph to come out to be a line and you cannot tell anything about its shape or the relationships from such a plot.
• Sometimes students swap the x and y axes, which can lead to errors in classifying the graphs's shape. (See the radical example above).
• Students often do not label the axes with the proper units or even tell what the graph is attempting to display.
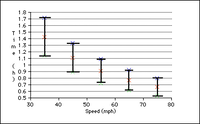
• Students should mark each data point with an x and draw the best-fit line through as many x's as possible.
• If a range of measurements exists for a particular value of the independent variable, the student should plot the maximum and minimum using an i-bar and plot the mean value with an X as shown here. The red x's represent the mean or average value. This actually gets a lot more complicated in more advanced classes; the I-bar is supposed to represent your confidence that the correct answer lies near your average.
Connections
To get numbers for your graph, you'll have to do an experiment to obtain the data. Once you have a graph, you can analyze it to see if there is a specific relationship between the two variables. If you're lucky you can even infer or derive an equation which allows you to make further predictions.
Equation Analysis
The analysis of equations can save you tremendous amounts of time and effort. With relatively little effort, you can learn to read an equation in much the same way as you read a sentence. Then you will get more meaning from the equation than just a series of letters strung out in a row.
Learning to analyze an equation is a lot like learning to read for the first time. Let's go through an example to see why.
Consider the equation. Read it aloud.
F = ma
Stage One : Learning your letters (preschool)
When asked to read this equation, most students will say: " F equals M . A. " Everyone understands that this means to write the equation down in the standard way. There's no harm in that; however, it does not lend much understanding regarding what the letters mean.
Stage Two: Letters stand for other things (Kindergarten)
These four symbols actually convey a lot more information than that. Ignoring the vectors involved for advanced physics, let's just say F stands for force, m stands for mass, and 'a' stands for acceleration. With that in hand, now we can read the equation as:
"Force equal sign mass acceleration."
Which is at least better than unidentifable letters.
Stage Three: A sentence is more than the sum of its parts (Elementary School)
Eventually readers learn that aside from being labels for things, sentences describe ideas, thoughts, situations, conditions, and so on. So when a sentence like "See Spot Run," for example, is read, an image of a dog running along the ground is formed. This has more meaning than knowing just that Spot is a dog, and running means going fast. In the same way, equations give instruction about what to do with the terms inside and how they work together just like "Spot" and "running" work together to make a mental image.
Equals signs, obviously, mean that the things on the left are the same as the things on the right. Two letters written side by side without a symbol means they are multiplied together. Now we can get some meaning out of the sentence by interpreting it as:
"Force equals mass multiplied by acceleration"
Which at least tells us what to do with the numbers once we have them. Most students, entering high school, can interpret most equations like this although they may have some difficulty with the order of operations or interpreting special symbols such as sin(x) or 103. However, that's not the whole story.
Stage Four: Learn to read for meaning and purpose. (High School)
An advanced reader will feel, well, unsatisfied with "See Spot Run." It's simplistic and doesn't tell you the important things like "Why does Spot Run?" and "Where is Spot Going?" and "Where is Spot's Owner?" In other words, using your imagination and prior knowledge (such as material you've already read) you can read, or imagine, an entire story about Spot:
Jan and Rayce decided to go to the park to play. They took along their Frisbee and some dog treats, and of course, their dog Spot. Each time they'd throw the frisbee, Spot would run and catch it in return for a dog treat. Once Jan threw the frisbee over a fence by accident. Spot accelerated to jump the fence. "See Spot run!" cried Rayce.
In the same way, a mathematical equation, especially in science, can have an entire history of information behind it. F = ma is a summary of many important ideas, which, when stated simply, reads:
"The net force on an object is equal to the product of its mass and its instantaneous acceleration. Objects accelerate in the direction of the net force acting on them."
Which can be "expanded" to mean (with some small loss of technical information about the direction of the force and acceleration):
Force and mass are directly related when acceleration is constant.
Force and acceleration are directly related when mass is constant.
Mass and acceleration are inversely related when force is constant.
Which, in layman's terms, means:
1. You have to push a big object harder to make it move the same way as a smaller object.
2. If you push an object harder, it will pick up more speed in the same time.
3. If you push a larger object with the same force as a smaller object, the smaller object will go faster in the same time.
Decompressing Equations
How can all of THAT be built into just four symbols? "F=ma". That's a lot of information for just four symbols.
This is how. Through the skill of "Equation Analysis" nearly any equation can be broken up into the various relationships that make it up. Best of all, there are only five rules for doing so. (At least at first.)
Rule #1.
If two variables appear on opposite sides of an equals sign, and neither is being acted on by another function (like being squared, taking the square root, or being divided into something else), then the variables have a direct relationship.
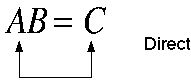
In a direct relationship, changing one variable causes the other one to change by the same factor.
For example, if you work twice as many hours, you make twice as much money.
Rule #2.
If two variables appear on the SAME side of an equals sign, and they are simply multiplied together; OR if they appear on OPPOSITE sides of the equal sign and one of them is in the denominator of a fraction, they have an INVERSE relationship.
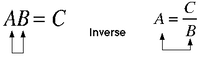
In an inverse relationship, changing one variable causes the other one to change by one over the same factor (the mathematical inverse).
For example, if you drove a certain distance twice as fast, it only takes half the time. Three times as fast is one third the time, and four times as fast is one fourth the amount of time, and so on.
Rule #3:
If two variables are on opposite sides of the equals sign, and one of them is squared, it is said to have a quadratic relationship with the other.
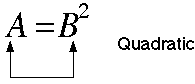
In a quadratic relationship, doubling the squared variable (B is squared here) will cause the other variable to quadruple. Tripling the squared variable causes the other variable to increase by a factor of 9, and so on according to the following table:
Factor by which B changes
Effect on A
2 x larger
4 x larger
3 x larger
9 x larger
4 x larger
16 x larger
5 x larger
25 x larger
6 x larger
36 x larger
...and so on
For example, the stopping distance needed by a car is quadratically related to the speed of the car. That means, a car travelling at 90 miles per hour will require 9 times farther to stop than a car traveling at 30 miles per hour!
Corollary to Rule #3: what about the other way around?
In this example above, A has a Quadratic relationship to B. However, B does not have a quadratic relationship to A! This is because doubling B will cause A to quadruple (a quadratic relationship), but doubling A does not cause B to quadruple. Instead, they B has a radical relationship to A, which can be seen by taking the square root of both sides of this equation. This is called a radical relationship.
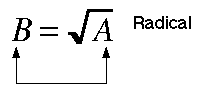
If A quadruples, A is only twice as large.
Rule #4: Relationships can combine and happen at the same time. If, for example, a variable appears on the opposite side of the equals sign, in the denominator of a fraction (making it inverse) and is squared (making it quadratic), the relationship is called inversely quadratic, or more traditionally, inverse-r-squared.
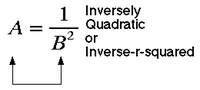
For example, the moon is 60 times farther away from the center of the earth than you are. Gravity behaves as an inverse r squared force; so at the distance of the moon, the earth's gravity is only 1/3600 times as much. Inverse r squared forces behave according to the following table:
Times farther away
Factor that force changes
1
1
2
1/4
3
1/9
4
1/16
5
1/25
and so on
Why is it called an inverse-r-squared force? r stands for the radius of a circle, and gravity, light, and other inverse-r-squared phenomena radiate out in a spherical pattern. So r is just how far you are away from the source. It could just as easily be "d" for distance.
Rule #5:
Equation analysis is simpler if the equation is simplified. Therefore, get rid of radicals by squaring both sides; get rid of denominators by multiplying both sides of the equation by the denominator. That effectively reduces most relationships to just three types: direct, inverse, and quadratic.
Along with classifying the types of relationships, you can also make predictions about what the graphs will look like, and what effect changing one variable (as an independent variable) has on the other variable (as a dependent variable).
Consider the following example.
Suppose you're driving a car from Antioch to Concord. While driving 60 miles per hour, the approximately 20 mile trip takes a certain amount of time. If you drove thirty miles per hour, how many times longer or shorter would the trip take?
The hard way
The most direct way to solve such a problem would be to work it twice and compare the two answers. So here goes:
First trip: time = distance / speed, so time = 20 miles / 60 mph , which is 0.33 hours or 20 minutes.
Second trip: time = distance /speed, so time = 20 miles / 30 mph, which is 0.66 hours or 40 minutes.
Comparing 40 minutes to 20 minutes we see the trip takes twice as long.
The easy way
A better way to solve such a problem is to identify the relationships in the equation and ask what effect is implied. for time = distance / speed, time and speed have an inverse relationship. Having an inverse relationship means that as one variable gets larger, the other gets smaller by the same factor; so halving (multiplying by 1/2) the speed will cause the time to increase by a factor of 2. So the answer is "twice as long".
Example 2:
Suppose you're doing an experiment to determine how the period (time to swing back and forth once) of a pendulum is affected by the length of the pendulum's "string" (assuming a small, compact pendulum bob a the end of a relatively long string in a frictionless environment) you would find something like the following:
Length (cm)
Period (sec)
0
0
10
0.63
20
0.90
30
1.10
40
1.27
50
1.42
60
1.55
70
1.68
80
1.80
90
1.90
100
2.01
A quick examination of the data doesn't reveal anything obvious other than as the length gets longer, the period gets longer (which makes sense). However, if you graphed the data, you'd see something more interesting:
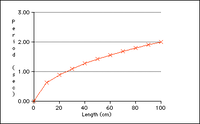
This is a radical graph, which implies that the period of the pendulum is related to the
Click here!
Square root
of the length of the string.
That means, without further calculation or analysis, if a pendlum string is nine times longer than another, the time it takes to swing back and forth once will be
Click here!
three times because the square root of 9 is three
times as long.
Other rules
• Don't analyze constants such as g, 1/2, or operators such as +/-, cos, sin, or the square root symbol.
• Beware of two-letter variables (nonstandard for professional scientists) such as KE (kinetic energy) or PE (potential energy). These are just one variable. K does not have an inverse relationship to E for example.
Shared Example for Equations
Consider the equation d = 1/2gt2. In this equation, distance and time are the only variables; the other symbols are constants.
What is the relationship between distance and time in this equation?
Click here!
Quadratic
This means that if an object falls three times as long, it will fall
Click here!
Nine Times because 3 squared (quadratic) is 9.
as far.
To find out how an experiment using these variables could be set up, click here.
To find out how the graph for this example would appear, click here.
Going Further
For advanced students, consider constructing the graph shapes and proportion rules for other functions not described here such as:
Sinusoidal ( y = sin(x), y = cos (x))
Exponential (y = Ax)
Logarithmic ( y = log x, y = ln x)
...and what other functions could be added to this list?
Master Summary
Kind of Relationship
Example equation
Shape of graph
Experimental Design
Real World Example
Effect of doubling independent variable
Effect of tripling independent variable
Effect of cutting independent variable in half
Direct
A = BC
A and B are direct.
Linear

Let B be independent, and A is dependent. C is interfering.
Dollars Earned = hours worked x hourly rate.
Dollars and hours are direct.
Dependent variable doubles
Twice the hours-> twice the money
Dependent variable triples
Three times the hours-> three times the money
Dependent variable gets cut in half
Half the hours -> half the money
Inverse
A = BC
B and C are inverse.
Inverse

Let B be independent and C be dependent. A is interfering.
If you travel a fixed distance at various speeds, using Distance = Speed x time, speed and time are inversely related.
Dependent variable gets cut in half
Twice the speed -> half the time
Dependent variable cut to 1/3 of original value
Triple the speed -> one third the time
Dependent variable doubles
Half the speed -> twice the time
Quadratic
A = B2
A is quadratically related to B, but B is not quadratically related to A
Quadratic

Let B be independent and A be independent. Any other variable is interfering.
Stopping distance = a constant times your speed squared.
Dependent variable quadruples.
Twice the speed-> four times the stopping distance
Dependent variable gets 9 x bigger
Three times the speed -> 9 x the stopping distance
Dependent variable gets 4 times SMALLER.
Half the speed ->you can stop in 1/4 the distance
Radical
B = Square Root of (A)
B is radically related to A, but A is not radically related to B.
Radical

Let A be independent and B be dependent.
Time for a pendulum to swing = the square root of its length times some constants.
Dependent variable gets square root of 2 times larger.
Dependent variable gets square root of 3 times larger.
Dependent variable gets square root of 1/2 (which is .707) times as large.
Inversely Quadratic or Inverse-r-squared
A = 1/B2
Inversely Quadratic

Let B be independent and A be dependent.
The brightness of a light bulb is inversely and quadratically related to your distance from it (if the bulb is small.)
Dependent variable gets 4 times smaller.
Dependent variable gets 9 times smaller.
Dependent variable gets 4 times bigger.
Glossary
Cause -- A change in condition which makes another change happen as a result. The independent variable is a cause if it makes the dependent variable of an experiment change.
Dependent Variable - The variable you observe in an experiment. The result or the effect of the cause.
Dimensional Analysis - The practice of combining and simplifying units of measurement using the rules of Algebra. For example, mph times by hours yields miles.
Direct - Kind of simple relationship where changing one variable makes the same exact proportional change in another. In an equation, the variables are on opposite sides of the equals sign.
Double-blind experiment - Kind of experimenter where the experimenter doesn't know who is getting the treatment (independent variable settings) until after the experiment is over, to remove prejudice and unconscious skewing of the results.
Effect - Result of the change made in the independent variable. Where there's a cause, there's an effect. Another name for dependent variable.
Experiment - A test of a hypothesis to see if it is true or false. Involves changing an independent variable to see its effect on a dependent variable while holding interfering variables constant.
Experimental Variable - Another name for independent variable.
Fact - An observation agreed to be accurate by the majority of relevant experts in the field.
Horizontal axis - the x-axis, or the variable that goes on the sideways axis off to the right of the origin.
Inverse - A kind of relationship which has a downhill, sloped graph that starts steep and ends flat. In an inverse relationship changing one variable has the exact same proportional change on the other, except the change is inverse (1/x).
Inversely Quadratic - A kind of relationship which has a downhill, sloped graph steeper and deeper than an inverse grave. In this kind of relationship changing the independent variable causes the dependent variable to decrease by a factor of 1/x2.
Independent variable - The thing you change in an experiment. You control it or choose it. Sometimes called the cause or the experimental variable or the treatment.
Interfering variable - Variables which could be independent, could cause the effect, but you don't want them to; so you keep them constant so they won't interfere.
Law, Natural - A very old, and trusted theory.
Linear - A straight line graph. Direct relationships have this kind of graph.
Multi-Dimensional Experiment - A series of experiments with more than one independent variable, conducted independently, and summarized later.
Natural Law - A very old, and trusted theory.
Hypothesis - A testable educated guess; a building block of scientific theories. The structure of a hypothesis is: I predict that changing the independent variable will have this effect on the dependent variable.
Quadratic - A kind of relationship with a graph that starts out flat, but rapidly tilts uphill in a parabolic pattern. In a quadratic relationship, changing the squared variable causes the unsquared variable to increase quadratically. In a quadratic equation, one variable is squared, and the other is on the opposite side of the equals sign.
Radical - A kind of graph and a kind of relationship. The graph starts uphill steeply, then flattens out. The relationship is characterized by having one variable under a radical sign (square root) and the other on the opposite side of the equals sign.
Random Error - Uncontrolled error caused by natural effects of the inaccuracy of measurement (NOT by careless measurement). The only cure for truly random error is LOTS of data.
Theory - Theories do three things. They explain the results of past experiments. They predict the outcome of future experiments (and thereby are a source of hypotheses). The must also not contradict other well-understood laws and theories.
Treatment - Usually in the biological or behavioral sciences, another term for independent variable.
Unit of measurement -an agreed upon standard for measuring, such as feet, seconds, grams, m/s, and so on.
Vertical axis -the y axis, where the dependent variable is usually plotted.
Variable - a thing which can be measured and can change. Not a noun, but an adjective.
California Science Standards Addressed by GREEAT Science
1. Scientific progress is made by asking meaningful questions and conducting careful investigations. As a basis for understanding this concept, and to address the content the other four strands, students should develop their own questions and perform investigations. Students will:
a. select and use appropriate tools and technology (such as computer-linked probes, spread sheets, and graphing calculators) to perform tests, collect data, analyze relationships, and display data.
b. identify and communicate sources of unavoidable experimental error.
c. identify possible reasons for inconsistent results, such as sources of error or uncontrolled conditions.
d. formulate explanations using logic and evidence.
e. solve scientific problems using quadratic equations, and simple trigonometric, exponential, and logarithmic functions.
f. distinguish between hypothesis and theory as science terms.
g. recognize the use and limitations of models and theories as scientific representations of reality.
h. read and interpret topographic and geologic maps.
i. analyze the locations, sequences, or time intervals of natural phenomena (e.g., relative ages of rocks, locations of planets over time, and succession of species in an ecosystem).
j. recognize the issues of statistical variability and the need for controlled tests.
k. recognize the cumulative nature of scientific evidence.
l. analyze situations and solve problems that require combining and applying concepts from more than one area of science.
m. investigate a science-based societal issue by researching the literature, analyzing data, and communicating the findings. Examples include irradiation of food, cloning of animals by somatic cell nuclear transfer, choice of energy sources, and land and water use decisions in California.
n. know that when an observation does not agree with an accepted scientific theory, sometimes the observation is mistaken or fraudulent (e.g., Piltdown Man fossil or unidentified flying objects), and sometimes the theory is wrong (e.g., Ptolemaic model of the movement of the sun, moon and planets).
Updated November 2002
Jeff Adkins
Please send email feedback to this address: jeffadkins@antioch.k12.ca.us
Copyright 2002 Jeff Adkins/Adaptive Consulting. Permission is granted for any Deer Valley HS student to print and save this file for educational purposes. Please contact me for permission to publish in other venues.
Preheat the oven to 350 degrees F. Butter or spray two 8- or 9-inch cake pans, 24 muffin tins, or one 9- x 13-inch cake pan and coat each pan with 1 teaspoon of flour. Using an electric mixer, cream the butter and incorporate the sugar, beating slowly for 2 minutes until smooth. Add the eggs and the vanilla extract and beat 2 minutes more. Combine the flour, cornstarch (if using), baking powder, and salt in a 2-quart mixing bowl. Starting and ending with the flour, alternate flour and milk additions, scraping down the sides of the mixing bowl two or three times, until the batter is smooth. Spread the batter evenly in the prepared cake pans. Bake about 30 to 35 minutes, until golden on top and springy to the touch; a toothpick inserted in the middle should come out clean. Don't overbake. Bake cupcakes about 20 minutes. Allow the layers to cool 10 minutes in their pans, then tap along the edges to loosen. Nudge the layers out of their pans onto wax paper so the bottoms cool before you ice them. When you are ready to ice, tear wax paper into strips to tuck under the cake edges to protect the serving plate. Choose any favorite icing; they all go with this cake.
Makes two 8- or 9-inch rounds, 24 cupcakes, or one 9- x 13-inch sheet cake
Source: www.recipe.com
Now let's suppose you make this cake, and, with apologies to www.recipe.com, it turns out too dry. What could you do to make the cake moister? Well, you could
• Add more eggs
• Add more milk
• Don't bake quite so long
• Add more butter (which melts)
• Use less flour
• Bake at a lower temperature
Now, if you did all these things at once, it would be hard to predict what might happen to the cake's flavor. It might be moister, but it might also taste bad; it might be so moist it doesn't finish baking; it might be too moist and soggy; or it might be just what you're looking for. However, if you're a professional chef, you couldn't afford to waste the time (and ingredients) on such a hit-or-miss approach to improving the recipe. You'd want to do it systematically, so that you could tell what thing you did made the cake taste better. That means you'd want to pick just one thing, and change that, like for example, the milk:
1 1/2 cups milk
or maybe
1 3/4 cups milk
or even
2 cups milk
In this way, by only changing one thing, the risk of ruining the cake (and not being able to eat it is lessened, yet you still gain the information needed to improve the cake.
So let's review. In this mini-experiment you changed one thing (the milk) watched one thing (the moistness) and kept the rest the same (baking time, baking temperature, butter, eggs, and everything else). If the experiment works, you could say that the amount of milk causes the moistness to change.
The structure of a basic experiment
In more formal scientific terms, we say we change the independent variable, watch the dependent variable, and keep the interfering variables the same, so they won't interfere. What do these big words mean? A variable is a thing which can be measured. They're simply labels for the very easy ideas we've already discussed.
Independent variable
- The cause
- What the experimenter changes to see if it causes an effect
Dependent variable
- The effect
- What the experimenter observes after changing something
Interfering variable
- Possible causes
- What the experimenter keeps the same to avoid possible interference with the results
The interfering variables are hard for some students to understand. Just remember the cake example: if you change the milk and the eggs, you won't know which thing made the cake moister. So change the milk, and leave the eggs alone. If you don't the eggs will interfere in the results. Get it?
Definition of a hypothesis
In the cake-baking example, the experimenter wanted to know if changing the milk caused the moistness to change. We call this a hypothesis. You can test to see whether or not it works. The hypothesis is a question the experiment is designed to answer. It must contain the independent and dependent variables at least (the interfering variables are assumed to be under control). It usually has the form of a prediction based on past experience. So, for the cake-baking example, the hypothesis is:
Increasing the amount of milk will probably make the cake moister.
Notice the independent variable (amount of milk) and the dependent variable (cake moistness) are both mentioned.
A generic hypothesis usually has the form:
This change in the independent variable will make the dependent variable do that.
Examples
Let's look at some examples of experiment hypotheses (plural of hypothesis).
Example 1.
A student investigating electrical circuits changes the voltage on a resistor to see the current gets larger or smaller.
Independent variable: voltage
Dependent variable : current
Interfering variable : resistance of the resistor is the only one mentioned. There may be others, such as the temperature of the resistor or the kind of wire used to connect it.
Example 2.
A student reads the correct horoscope from the right day to a group of people and asks them if they think it applies to them. Later, the student reads the wrong horoscope from the wrong day to a different group of people and asks them the same question. The student is trying to find out if people can tell the difference between the right and wrong horoscopes, and infer from that whether or not astrology actually works.
Independent variable: whether or not you read the right horoscope to a person.
Dependent variable: what they say in answer to the question: Does this apply to you?
Interfering variable: The only one that is mentioned is what question you ask ("asks them the same question"). There are many others, for example, how you read the question (giving away the secret), who you ask, whether or not you know the horoscope is right and unconciously reveal it, and so on.
This experiment would be a good case for using the "double-blind" design, where the experimenter doesn't know if they are reading the right horoscope or not. To improve the design, the experimenter would have to have a 3rd person, probably an assistant, scramble the horoscopes so that the experimenter wouldn't know whether or not the correct horoscope was being read to the subject. In that way the experimenter's prejudices wouldn't interfere. When the results are done, the assistant unscrambles the results and sorts them according to the independent variable.
See if you can predict the independent, dependent, and interfering variables for these sample experiments.
Example 3.
A student increases the force on a rolling cart to see how its acceleration changes.
Independent variable:
Click here!
Force on the cart
Dependent variable:
Click here!
Acceleration of the cart
Interfering variables:
Click here!
The mass of the cart is the only one mentioned .
The surface used is another.
The friction in the carts' wheels is another.
Example 4.A student moves a light sensor farther away from a light bulb to see if the brightness of the bulb changes.
Independent variable.
Click here!
Distance from bulb to sensor
Dependent variable:
Click here!
The brightness of the bulb, as measured with the sensor.
Interfering variables:
Click here!
None are directly mentioned.
The voltage used to light the bulb must be constant.
The room lights must be off.
If a computer is used its screen must be dimmed and turned
away.
If the surroundings are black instead of white there will
be less reflected light.
The sensor should not be too close to the light bulb or
it won't look like a point source.
Designing an experiment
With those results in hand, it is now time to try designing an experiment of your own. Click on the pop-up menus below to design your own experiment.
The purpose of this experiment is to study the motion of an object; say, a car driving on a little trip. Pick a variable for each blank presented and remember, you can only use a variable ONCE.
In my experiment, I am going to investigate the effect of changing the
Independent variable
speed of the car
distance the car travels
time it takes to get there
on the
dependent variable
speed of the car
distance the car travels
time it takes to get there
, while keeping the
interfering variable
speed of the car
distance the car travels
time it takes to get there
constant.
Shared Example for experimental design
Suppose an experimenter used the following hypothesis:
The longer I let a rock fall, the farther it will fall. In fact, it will fall four times farther if I let it fall twice as long, exhibiting a special relationship between time and distance.
In this experiment, the independent variable is time. The experimenter CHOOSES to select the time when the measurements will be made; so in some sense the experimenter is controlling time. They could do this by filming the rock falling, for example, and only examining every 60th picture so that information is gathered for each second, ignoring the other 59 pictures made along the way.
Therefore the dependent variable is distance. The experimenter measures this as a result of the time he or she chose to observe.
There are any number of interfering variables such as air resistance, the shape of the rock, and where the experiment is conducted (on earth or some other planet). These things must be eliminated by using a heavy rock, using a smooth symmetrical rock (not lumpy) and doing the experiment in the same place.
To see some sample data and graphs for such an experiment, click here.
To see the equation for an object which falls and how to analyze it, click here.
Connections
Once you have your results, it's traditional to graph them (if numbers) or display them in a table (if words). Traditionally, you present a data table with the independent and dependent data, and a graph with the independent variable on the x-axis and the dependent variable on the y-axis. These topics are covered elsewhere on this page. Once you have a graph, you can analyze it to see if there is a specific relationship between the two variables. If you're lucky you can even infer or derive an equation which allows you to make further predictions.
Advanced tips
Here are a few tips for designing your own experiments:
• More data is always better. Not only should you have several different values for the independent variable, you should repeat each one several times. Accuracy of experimental results is an entire topic unto itself.
• If you want to find out the effect of changing more than one variable at a time, you can do a series of experiments called a multi-dimensional experiment where you do one whole experiment by changing the independent variable, then do another experiment by changing a different independent variable, and so on. Often 3-d graphs are used to display such results.
• A variable is a thing that can be measured, not a thing. Think of a variable as an adjective, not a noun. So don't list "car" as the independent variable; list "speed of the car", or "weight of the car" or "color of the car" or "year of manufacture".
Graph Analysis
This section is not intended as a replacement for learning how to make a graph. Rather, its function is to show how to analyze a graph you have already made to find out what kind of relationship exists in it.
By tradition, when you have completed an experiment, you typically plot the results on a grid with the independent variable on the x-axis, and the dependent variable on the y-axis.
A good graph has what is being measured written on each axis, along with the unit of measurement. In the language of experimental design, this is called a "Dependent versus Independent" graph.
Any time you see the word "versus" describing a graph, the words before "versus" go on the y-axis, and the words after "versus" go on the x-axis. Incidentally, this is very difficult to control on a spreadsheet unless you set your columns up correctly: y is the left column, x is the right column, and use "X-Y Scatterplot" style graphing.
Also, the data is displayed in a table with the independent variable on the left column, and the dependent variable on the right. This is because the independent variable is changed first, and happens first, and so it comes before the dependent variable, which happens later.
Graph shapes
Many graphs have a similar shape, and can be classified according to how they appear. The classifications describe what the shape looks like, and also provide clues about the relationships between the variables involved.
In high school science (up to 12th grade), graphs almost always can fit into one of the following shape categories:
• linear
• radical
• inverse
Combinations of these shapes can occur. The most common is a combination of inverse and quadratic called "inverse-r-squared" for reasons better explained elsewhere. Advanced classes may see two other kinds of graphs:
• logarithmic/exponential
• sinusoidal
In this document we will concentrate mainly on the four basic shapes; and while such combinations as "linearly quadratic" and "radical inverse" exist, we will pursue only examples you're likely to see in introductory science classes.
What the graphs look like
Linear
Linear graphs are straight lines, such as this graph used to find the density of a rock: The graphs of linear functions are said to have direct relationships. This means that whatever change happens to x, a proportional change exactly the same scale happens to y.
In this example, what is the mass of a 2 cc rock sample?
Click here!
9 grams
What is the mass of a 4 cc rock sample?
Click here!
18 grams
So you can see, for a linear graph, choosing an x- value twice as large makes the y-value twice as large as well.
In this experimental design, the experimenter changed the mass of the sample being looked at, and measured the resulting volume. Thus mass is independent, and volume is dependent.
Inverse
Inverse graphs are characterized by a "downhill slope" appearance because they represent relationships that make one thing larger as another thing gets smaller. In this example, a person drives the same trip over and over at various speeds. The person discovers, naturally enough, if you drive faster, it takes less time to get to your destination.
In an inverse graph, you can see that larger values of x lead to smaller values of y. In fact, going twice as fast should get you there in half the time. Compare 35 miles per hour to 70 miles per hour. At 35 miles per hour it takes about 1.45 hours to make the trip (50 miles in this case). At 70 miles per hour it takes about 0.73 hours, or half the amount of time.
In this experimental design, the speed was changed by the experimenter (so it is independent) resulting in different times for the trip (so time is dependent).
Quadratic
Quadratic relationships happen when one variable is quadratically related to another. This occurs when one of the variables is squared to obtain the other variable. In this example, the diameter of a pizza is compared to the area of the pizza.
Look at the area of a pizza which is 6 inches in diameter. About how much is it?
Click here!
About 28 square inches.
Now look at the area for a pizza with twice the diameter , or 12 inches. How much area does it have?
Click here!
About 113 square inches, which is 4 times larger.
So in a quadratic relationship, doubling the x-axis value causes the other value to increase four times. For more information about how quadratic relationships work, click here.
Radical
In a radical graph, the shape appears to go uphill at first, but then gradually flattens out. In this example, the time needed for a rock to fall a specified distance is measured.
In these relationships we find the dependent variable (time in this case) by taking the square root of the independent variable (distance fallen). (There are other factors involved; for an analysis of the equation that generates this graph, click here.) In other words, time is a function of the square root of distance in this example.
![]()
In these kind of relationships, it is often more convenient to swap the x- and y- axes and rewrite the relationship as a variation of a quadratic relationship. You can see by looking at this graph if we swap the axes we get a graph that looks like this:
Which is the graph for the equation
![]()
which has a quadratic relationship. So radical graphs are the same as quadratic graphs with the axes flipped. This is a graphical way of saying the mathematical rule:
To get rid of a square root in an equation all you do is square both sides.
Inversely Quadratic or Inverse-r-squared graphs.
Inverse-r-squared graphs refer to an important category of phenomena such as the strength of the force of gravity, the brightness of light, and other effects, which obey a relationship which is inverse at the same time it is quadratic. For more information about the mathematical relationship, click here.
Inverse-r-squared graphs look like inverse graphs, but they just "scoop out deeper." as shown here.
As with gravity, for example, the farther away you get the weaker the effect gets. If the relationship is inverse, if you get twice as far away, the effect is half as strong; but with inversely quadratic, if you get twice as far away, the effect is only one-quarter as strong. Click here for an example of an equation that behaves this way.
Shared Example for Graphs
Here is a data table a student used in an experiment about a falling object:
time (sec)
distance (m)
0
0
1
5
2
20
3
45
4
80
5
125
In this experiment time was independent (the experimenter decided how long to let the rock fall) and distance was dependent (the experimenter observed the distance the rock falls as a result.)
The graph the student generated from this data looks like this:
This graph has a
Click here!
Quadratic
shape.
To learn about the experimental design used to get this data, click here.
To learn about the equation that describes this data, click here.
Common Errors in Graphing
Students sometimes just copy the data onto the axes like this:
• This doesn't work because the y-axis values are not equally spaced. There should be the same size gap between each tick mark on the side of the graph, as in 40,80,120,160,200,240,280 as opposed to 0,40,10,275,276 as shown here. This type of error always causes the graph to come out to be a line and you cannot tell anything about its shape or the relationships from such a plot.
• Sometimes students swap the x and y axes, which can lead to errors in classifying the graphs's shape. (See the radical example above).
• Students often do not label the axes with the proper units or even tell what the graph is attempting to display.
• Students should mark each data point with an x and draw the best-fit line through as many x's as possible.
• If a range of measurements exists for a particular value of the independent variable, the student should plot the maximum and minimum using an i-bar and plot the mean value with an X as shown here. The red x's represent the mean or average value. This actually gets a lot more complicated in more advanced classes; the I-bar is supposed to represent your confidence that the correct answer lies near your average.
Connections
To get numbers for your graph, you'll have to do an experiment to obtain the data. Once you have a graph, you can analyze it to see if there is a specific relationship between the two variables. If you're lucky you can even infer or derive an equation which allows you to make further predictions.
Equation Analysis
The analysis of equations can save you tremendous amounts of time and effort. With relatively little effort, you can learn to read an equation in much the same way as you read a sentence. Then you will get more meaning from the equation than just a series of letters strung out in a row.
Learning to analyze an equation is a lot like learning to read for the first time. Let's go through an example to see why.
Consider the equation. Read it aloud.
F = ma
Stage One : Learning your letters (preschool)
When asked to read this equation, most students will say: " F equals M . A. " Everyone understands that this means to write the equation down in the standard way. There's no harm in that; however, it does not lend much understanding regarding what the letters mean.
Stage Two: Letters stand for other things (Kindergarten)
These four symbols actually convey a lot more information than that. Ignoring the vectors involved for advanced physics, let's just say F stands for force, m stands for mass, and 'a' stands for acceleration. With that in hand, now we can read the equation as:
"Force equal sign mass acceleration."
Which is at least better than unidentifable letters.
Stage Three: A sentence is more than the sum of its parts (Elementary School)
Eventually readers learn that aside from being labels for things, sentences describe ideas, thoughts, situations, conditions, and so on. So when a sentence like "See Spot Run," for example, is read, an image of a dog running along the ground is formed. This has more meaning than knowing just that Spot is a dog, and running means going fast. In the same way, equations give instruction about what to do with the terms inside and how they work together just like "Spot" and "running" work together to make a mental image.
Equals signs, obviously, mean that the things on the left are the same as the things on the right. Two letters written side by side without a symbol means they are multiplied together. Now we can get some meaning out of the sentence by interpreting it as:
"Force equals mass multiplied by acceleration"
Which at least tells us what to do with the numbers once we have them. Most students, entering high school, can interpret most equations like this although they may have some difficulty with the order of operations or interpreting special symbols such as sin(x) or 103. However, that's not the whole story.
Stage Four: Learn to read for meaning and purpose. (High School)
An advanced reader will feel, well, unsatisfied with "See Spot Run." It's simplistic and doesn't tell you the important things like "Why does Spot Run?" and "Where is Spot Going?" and "Where is Spot's Owner?" In other words, using your imagination and prior knowledge (such as material you've already read) you can read, or imagine, an entire story about Spot:
Jan and Rayce decided to go to the park to play. They took along their Frisbee and some dog treats, and of course, their dog Spot. Each time they'd throw the frisbee, Spot would run and catch it in return for a dog treat. Once Jan threw the frisbee over a fence by accident. Spot accelerated to jump the fence. "See Spot run!" cried Rayce.
In the same way, a mathematical equation, especially in science, can have an entire history of information behind it. F = ma is a summary of many important ideas, which, when stated simply, reads:
"The net force on an object is equal to the product of its mass and its instantaneous acceleration. Objects accelerate in the direction of the net force acting on them."
Which can be "expanded" to mean (with some small loss of technical information about the direction of the force and acceleration):
Force and mass are directly related when acceleration is constant.
Force and acceleration are directly related when mass is constant.
Mass and acceleration are inversely related when force is constant.
Which, in layman's terms, means:
1. You have to push a big object harder to make it move the same way as a smaller object.
2. If you push an object harder, it will pick up more speed in the same time.
3. If you push a larger object with the same force as a smaller object, the smaller object will go faster in the same time.
Decompressing Equations
How can all of THAT be built into just four symbols? "F=ma". That's a lot of information for just four symbols.
This is how. Through the skill of "Equation Analysis" nearly any equation can be broken up into the various relationships that make it up. Best of all, there are only five rules for doing so. (At least at first.)
Rule #1.
If two variables appear on opposite sides of an equals sign, and neither is being acted on by another function (like being squared, taking the square root, or being divided into something else), then the variables have a direct relationship.
In a direct relationship, changing one variable causes the other one to change by the same factor.
For example, if you work twice as many hours, you make twice as much money.
Rule #2.
If two variables appear on the SAME side of an equals sign, and they are simply multiplied together; OR if they appear on OPPOSITE sides of the equal sign and one of them is in the denominator of a fraction, they have an INVERSE relationship.
In an inverse relationship, changing one variable causes the other one to change by one over the same factor (the mathematical inverse).
For example, if you drove a certain distance twice as fast, it only takes half the time. Three times as fast is one third the time, and four times as fast is one fourth the amount of time, and so on.
Rule #3:
If two variables are on opposite sides of the equals sign, and one of them is squared, it is said to have a quadratic relationship with the other.
In a quadratic relationship, doubling the squared variable (B is squared here) will cause the other variable to quadruple. Tripling the squared variable causes the other variable to increase by a factor of 9, and so on according to the following table:
Factor by which B changes
Effect on A
2 x larger
4 x larger
3 x larger
9 x larger
4 x larger
16 x larger
5 x larger
25 x larger
6 x larger
36 x larger
...and so on
For example, the stopping distance needed by a car is quadratically related to the speed of the car. That means, a car travelling at 90 miles per hour will require 9 times farther to stop than a car traveling at 30 miles per hour!
Corollary to Rule #3: what about the other way around?
In this example above, A has a Quadratic relationship to B. However, B does not have a quadratic relationship to A! This is because doubling B will cause A to quadruple (a quadratic relationship), but doubling A does not cause B to quadruple. Instead, they B has a radical relationship to A, which can be seen by taking the square root of both sides of this equation. This is called a radical relationship.
If A quadruples, A is only twice as large.
Rule #4: Relationships can combine and happen at the same time. If, for example, a variable appears on the opposite side of the equals sign, in the denominator of a fraction (making it inverse) and is squared (making it quadratic), the relationship is called inversely quadratic, or more traditionally, inverse-r-squared.
For example, the moon is 60 times farther away from the center of the earth than you are. Gravity behaves as an inverse r squared force; so at the distance of the moon, the earth's gravity is only 1/3600 times as much. Inverse r squared forces behave according to the following table:
Times farther away
Factor that force changes
1
1
2
1/4
3
1/9
4
1/16
5
1/25
and so on
Why is it called an inverse-r-squared force? r stands for the radius of a circle, and gravity, light, and other inverse-r-squared phenomena radiate out in a spherical pattern. So r is just how far you are away from the source. It could just as easily be "d" for distance.
Rule #5:
Equation analysis is simpler if the equation is simplified. Therefore, get rid of radicals by squaring both sides; get rid of denominators by multiplying both sides of the equation by the denominator. That effectively reduces most relationships to just three types: direct, inverse, and quadratic.
Along with classifying the types of relationships, you can also make predictions about what the graphs will look like, and what effect changing one variable (as an independent variable) has on the other variable (as a dependent variable).
Consider the following example.
Suppose you're driving a car from Antioch to Concord. While driving 60 miles per hour, the approximately 20 mile trip takes a certain amount of time. If you drove thirty miles per hour, how many times longer or shorter would the trip take?
The hard way
The most direct way to solve such a problem would be to work it twice and compare the two answers. So here goes:
First trip: time = distance / speed, so time = 20 miles / 60 mph , which is 0.33 hours or 20 minutes.
Second trip: time = distance /speed, so time = 20 miles / 30 mph, which is 0.66 hours or 40 minutes.
Comparing 40 minutes to 20 minutes we see the trip takes twice as long.
The easy way
A better way to solve such a problem is to identify the relationships in the equation and ask what effect is implied. for time = distance / speed, time and speed have an inverse relationship. Having an inverse relationship means that as one variable gets larger, the other gets smaller by the same factor; so halving (multiplying by 1/2) the speed will cause the time to increase by a factor of 2. So the answer is "twice as long".
Example 2:
Suppose you're doing an experiment to determine how the period (time to swing back and forth once) of a pendulum is affected by the length of the pendulum's "string" (assuming a small, compact pendulum bob a the end of a relatively long string in a frictionless environment) you would find something like the following:
Length (cm)
Period (sec)
0
0
10
0.63
20
0.90
30
1.10
40
1.27
50
1.42
60
1.55
70
1.68
80
1.80
90
1.90
100
2.01
A quick examination of the data doesn't reveal anything obvious other than as the length gets longer, the period gets longer (which makes sense). However, if you graphed the data, you'd see something more interesting:
This is a radical graph, which implies that the period of the pendulum is related to the
Click here!
Square root
of the length of the string.
That means, without further calculation or analysis, if a pendlum string is nine times longer than another, the time it takes to swing back and forth once will be
Click here!
three times because the square root of 9 is three
times as long.
Other rules
• Don't analyze constants such as g, 1/2, or operators such as +/-, cos, sin, or the square root symbol.
• Beware of two-letter variables (nonstandard for professional scientists) such as KE (kinetic energy) or PE (potential energy). These are just one variable. K does not have an inverse relationship to E for example.
Shared Example for Equations
Consider the equation d = 1/2gt2. In this equation, distance and time are the only variables; the other symbols are constants.
What is the relationship between distance and time in this equation?
Click here!
Quadratic
This means that if an object falls three times as long, it will fall
Click here!
Nine Times because 3 squared (quadratic) is 9.
as far.
To find out how an experiment using these variables could be set up, click here.
To find out how the graph for this example would appear, click here.
Going Further
For advanced students, consider constructing the graph shapes and proportion rules for other functions not described here such as:
Sinusoidal ( y = sin(x), y = cos (x))
Exponential (y = Ax)
Logarithmic ( y = log x, y = ln x)
...and what other functions could be added to this list?
Master Summary
Kind of Relationship
Example equation
Shape of graph
Experimental Design
Real World Example
Effect of doubling independent variable
Effect of tripling independent variable
Effect of cutting independent variable in half
Direct
A = BC
A and B are direct.
Linear
Let B be independent, and A is dependent. C is interfering.
Dollars Earned = hours worked x hourly rate.
Dollars and hours are direct.
Dependent variable doubles
Twice the hours-> twice the money
Dependent variable triples
Three times the hours-> three times the money
Dependent variable gets cut in half
Half the hours -> half the money
Inverse
A = BC
B and C are inverse.
Inverse
Let B be independent and C be dependent. A is interfering.
If you travel a fixed distance at various speeds, using Distance = Speed x time, speed and time are inversely related.
Dependent variable gets cut in half
Twice the speed -> half the time
Dependent variable cut to 1/3 of original value
Triple the speed -> one third the time
Dependent variable doubles
Half the speed -> twice the time
Quadratic
A = B2
A is quadratically related to B, but B is not quadratically related to A
Quadratic
Let B be independent and A be independent. Any other variable is interfering.
Stopping distance = a constant times your speed squared.
Dependent variable quadruples.
Twice the speed-> four times the stopping distance
Dependent variable gets 9 x bigger
Three times the speed -> 9 x the stopping distance
Dependent variable gets 4 times SMALLER.
Half the speed ->you can stop in 1/4 the distance
Radical
B = Square Root of (A)
B is radically related to A, but A is not radically related to B.
Radical
Let A be independent and B be dependent.
Time for a pendulum to swing = the square root of its length times some constants.
Dependent variable gets square root of 2 times larger.
Dependent variable gets square root of 3 times larger.
Dependent variable gets square root of 1/2 (which is .707) times as large.
Inversely Quadratic or Inverse-r-squared
A = 1/B2
Inversely Quadratic
Let B be independent and A be dependent.
The brightness of a light bulb is inversely and quadratically related to your distance from it (if the bulb is small.)
Dependent variable gets 4 times smaller.
Dependent variable gets 9 times smaller.
Dependent variable gets 4 times bigger.
Glossary
Cause -- A change in condition which makes another change happen as a result. The independent variable is a cause if it makes the dependent variable of an experiment change.
Dependent Variable - The variable you observe in an experiment. The result or the effect of the cause.
Dimensional Analysis - The practice of combining and simplifying units of measurement using the rules of Algebra. For example, mph times by hours yields miles.
Direct - Kind of simple relationship where changing one variable makes the same exact proportional change in another. In an equation, the variables are on opposite sides of the equals sign.
Double-blind experiment - Kind of experimenter where the experimenter doesn't know who is getting the treatment (independent variable settings) until after the experiment is over, to remove prejudice and unconscious skewing of the results.
Effect - Result of the change made in the independent variable. Where there's a cause, there's an effect. Another name for dependent variable.
Experiment - A test of a hypothesis to see if it is true or false. Involves changing an independent variable to see its effect on a dependent variable while holding interfering variables constant.
Experimental Variable - Another name for independent variable.
Fact - An observation agreed to be accurate by the majority of relevant experts in the field.
Horizontal axis - the x-axis, or the variable that goes on the sideways axis off to the right of the origin.
Inverse - A kind of relationship which has a downhill, sloped graph that starts steep and ends flat. In an inverse relationship changing one variable has the exact same proportional change on the other, except the change is inverse (1/x).
Inversely Quadratic - A kind of relationship which has a downhill, sloped graph steeper and deeper than an inverse grave. In this kind of relationship changing the independent variable causes the dependent variable to decrease by a factor of 1/x2.
Independent variable - The thing you change in an experiment. You control it or choose it. Sometimes called the cause or the experimental variable or the treatment.
Interfering variable - Variables which could be independent, could cause the effect, but you don't want them to; so you keep them constant so they won't interfere.
Law, Natural - A very old, and trusted theory.
Linear - A straight line graph. Direct relationships have this kind of graph.
Multi-Dimensional Experiment - A series of experiments with more than one independent variable, conducted independently, and summarized later.
Natural Law - A very old, and trusted theory.
Hypothesis - A testable educated guess; a building block of scientific theories. The structure of a hypothesis is: I predict that changing the independent variable will have this effect on the dependent variable.
Quadratic - A kind of relationship with a graph that starts out flat, but rapidly tilts uphill in a parabolic pattern. In a quadratic relationship, changing the squared variable causes the unsquared variable to increase quadratically. In a quadratic equation, one variable is squared, and the other is on the opposite side of the equals sign.
Radical - A kind of graph and a kind of relationship. The graph starts uphill steeply, then flattens out. The relationship is characterized by having one variable under a radical sign (square root) and the other on the opposite side of the equals sign.
Random Error - Uncontrolled error caused by natural effects of the inaccuracy of measurement (NOT by careless measurement). The only cure for truly random error is LOTS of data.
Theory - Theories do three things. They explain the results of past experiments. They predict the outcome of future experiments (and thereby are a source of hypotheses). The must also not contradict other well-understood laws and theories.
Treatment - Usually in the biological or behavioral sciences, another term for independent variable.
Unit of measurement -an agreed upon standard for measuring, such as feet, seconds, grams, m/s, and so on.
Vertical axis -the y axis, where the dependent variable is usually plotted.
Variable - a thing which can be measured and can change. Not a noun, but an adjective.
California Science Standards Addressed by GREEAT Science
1. Scientific progress is made by asking meaningful questions and conducting careful investigations. As a basis for understanding this concept, and to address the content the other four strands, students should develop their own questions and perform investigations. Students will:
a. select and use appropriate tools and technology (such as computer-linked probes, spread sheets, and graphing calculators) to perform tests, collect data, analyze relationships, and display data.
b. identify and communicate sources of unavoidable experimental error.
c. identify possible reasons for inconsistent results, such as sources of error or uncontrolled conditions.
d. formulate explanations using logic and evidence.
e. solve scientific problems using quadratic equations, and simple trigonometric, exponential, and logarithmic functions.
f. distinguish between hypothesis and theory as science terms.
g. recognize the use and limitations of models and theories as scientific representations of reality.
h. read and interpret topographic and geologic maps.
i. analyze the locations, sequences, or time intervals of natural phenomena (e.g., relative ages of rocks, locations of planets over time, and succession of species in an ecosystem).
j. recognize the issues of statistical variability and the need for controlled tests.
k. recognize the cumulative nature of scientific evidence.
l. analyze situations and solve problems that require combining and applying concepts from more than one area of science.
m. investigate a science-based societal issue by researching the literature, analyzing data, and communicating the findings. Examples include irradiation of food, cloning of animals by somatic cell nuclear transfer, choice of energy sources, and land and water use decisions in California.
n. know that when an observation does not agree with an accepted scientific theory, sometimes the observation is mistaken or fraudulent (e.g., Piltdown Man fossil or unidentified flying objects), and sometimes the theory is wrong (e.g., Ptolemaic model of the movement of the sun, moon and planets).
Updated November 2002
Jeff Adkins
Please send email feedback to this address: jeffadkins@antioch.k12.ca.us
Copyright 2002 Jeff Adkins/Adaptive Consulting. Permission is granted for any Deer Valley HS student to print and save this file for educational purposes. Please contact me for permission to publish in other venues.
Cooking spray (optional)
- 1/2 pound (2 sticks) unsalted butter
- 1 1/2 cups sugar
- 3 eggs, slightly beaten
- 2 teaspoons vanilla extract
- 2 1/2 cups flour, sifted, or 3 cups cake flour (omit the cornstarch if using cake flour)
- 1/4 cup cornstarch (if using all-purpose flour)
- 1 tablespoon baking powder
- 1/4 teaspoon salt
- 1 cup milk
Preheat the oven to 350 degrees F. Butter or spray two 8- or 9-inch cake pans, 24 muffin tins, or one 9- x 13-inch cake pan and coat each pan with 1 teaspoon of flour. Using an electric mixer, cream the butter and incorporate the sugar, beating slowly for 2 minutes until smooth. Add the eggs and the vanilla extract and beat 2 minutes more. Combine the flour, cornstarch (if using), baking powder, and salt in a 2-quart mixing bowl. Starting and ending with the flour, alternate flour and milk additions, scraping down the sides of the mixing bowl two or three times, until the batter is smooth. Spread the batter evenly in the prepared cake pans. Bake about 30 to 35 minutes, until golden on top and springy to the touch; a toothpick inserted in the middle should come out clean. Don't overbake. Bake cupcakes about 20 minutes. Allow the layers to cool 10 minutes in their pans, then tap along the edges to loosen. Nudge the layers out of their pans onto wax paper so the bottoms cool before you ice them. When you are ready to ice, tear wax paper into strips to tuck under the cake edges to protect the serving plate. Choose any favorite icing; they all go with this cake.
Makes two 8- or 9-inch rounds, 24 cupcakes, or one 9- x 13-inch sheet cake
Source: www.recipe.com
Now let's suppose you make this cake, and, with apologies to www.recipe.com, it turns out too dry. What could you do to make the cake moister? Well, you could
• Add more eggs
• Add more milk
• Don't bake quite so long
• Add more butter (which melts)
• Use less flour
• Bake at a lower temperature
Now, if you did all these things at once, it would be hard to predict what might happen to the cake's flavor. It might be moister, but it might also taste bad; it might be so moist it doesn't finish baking; it might be too moist and soggy; or it might be just what you're looking for. However, if you're a professional chef, you couldn't afford to waste the time (and ingredients) on such a hit-or-miss approach to improving the recipe. You'd want to do it systematically, so that you could tell what thing you did made the cake taste better. That means you'd want to pick just one thing, and change that, like for example, the milk:
1 1/2 cups milk
or maybe
1 3/4 cups milk
or even
2 cups milk
In this way, by only changing one thing, the risk of ruining the cake (and not being able to eat it is lessened, yet you still gain the information needed to improve the cake.
So let's review. In this mini-experiment you changed one thing (the milk) watched one thing (the moistness) and kept the rest the same (baking time, baking temperature, butter, eggs, and everything else). If the experiment works, you could say that the amount of milk causes the moistness to change.
The structure of a basic experiment
In more formal scientific terms, we say we change the independent variable, watch the dependent variable, and keep the interfering variables the same, so they won't interfere. What do these big words mean? A variable is a thing which can be measured. They're simply labels for the very easy ideas we've already discussed.
Independent variable
The cause
What the experimenter changes to see if it causes an effect
Dependent variable
The effect
What the experimenter observes after changing something
Interfering variable
Possible causes
What the experimenter keeps the same to avoid possible interference with the results
The interfering variables are hard for some students to understand. Just remember the cake example: if you change the milk and the eggs, you won't know which thing made the cake moister. So change the milk, and leave the eggs alone. If you don't the eggs will interfere in the results. Get it?
Definition of a hypothesis
In the cake-baking example, the experimenter wanted to know if changing the milk caused the moistness to change. We call this a hypothesis. You can test to see whether or not it works. The hypothesis is a question the experiment is designed to answer. It must contain the independent and dependent variables at least (the interfering variables are assumed to be under control). It usually has the form of a prediction based on past experience. So, for the cake-baking example, the hypothesis is:
Increasing the amount of milk will probably make the cake moister.
Notice the independent variable (amount of milk) and the dependent variable (cake moistness) are both mentioned.
A generic hypothesis usually has the form:
This change in the independent variable will make the dependent variable do that.
Examples
Let's look at some examples of experiment hypotheses (plural of hypothesis).
Example 1.
A student investigating electrical circuits changes the voltage on a resistor to see the current gets larger or smaller.
Independent variable: voltage
Dependent variable : current
Interfering variable : resistance of the resistor is the only one mentioned. There may be others, such as the temperature of the resistor or the kind of wire used to connect it.
Example 2.
A student reads the correct horoscope from the right day to a group of people and asks them if they think it applies to them. Later, the student reads the wrong horoscope from the wrong day to a different group of people and asks them the same question. The student is trying to find out if people can tell the difference between the right and wrong horoscopes, and infer from that whether or not astrology actually works.
Independent variable: whether or not you read the right horoscope to a person.
Dependent variable: what they say in answer to the question: Does this apply to you?
Interfering variable: The only one that is mentioned is what question you ask ("asks them the same question"). There are many others, for example, how you read the question (giving away the secret), who you ask, whether or not you know the horoscope is right and unconciously reveal it, and so on.
This experiment would be a good case for using the "double-blind" design, where the experimenter doesn't know if they are reading the right horoscope or not. To improve the design, the experimenter would have to have a 3rd person, probably an assistant, scramble the horoscopes so that the experimenter wouldn't know whether or not the correct horoscope was being read to the subject. In that way the experimenter's prejudices wouldn't interfere. When the results are done, the assistant unscrambles the results and sorts them according to the independent variable.
See if you can predict the independent, dependent, and interfering variables for these sample experiments.
Example 3.
A student increases the force on a rolling cart to see how its acceleration changes.
Independent variable:
Click here!
Force on the cart
Dependent variable:
Click here!
Acceleration of the cart
Interfering variables:
Click here!
The mass of the cart is the only one mentioned .
The surface used is another.
The friction in the carts' wheels is another.
Example 4.A student moves a light sensor farther away from a light bulb to see if the brightness of the bulb changes.
Independent variable.
Click here!
Distance from bulb to sensor
Dependent variable:
Click here!
The brightness of the bulb, as measured with the sensor.
Interfering variables:
Click here!
None are directly mentioned.
The voltage used to light the bulb must be constant.
The room lights must be off.
If a computer is used its screen must be dimmed and turned
away.
If the surroundings are black instead of white there will
be less reflected light.
The sensor should not be too close to the light bulb or
it won't look like a point source.
Designing an experiment
With those results in hand, it is now time to try designing an experiment of your own. Click on the pop-up menus below to design your own experiment.
The purpose of this experiment is to study the motion of an object; say, a car driving on a little trip. Pick a variable for each blank presented and remember, you can only use a variable ONCE.
In my experiment, I am going to investigate the effect of changing the
Independent variable
speed of the car
distance the car travels
time it takes to get there
on the
dependent variable
speed of the car
distance the car travels
time it takes to get there
, while keeping the
interfering variable
speed of the car
distance the car travels
time it takes to get there
constant.
Shared Example for experimental design
Suppose an experimenter used the following hypothesis:
The longer I let a rock fall, the farther it will fall. In fact, it will fall four times farther if I let it fall twice as long, exhibiting a special relationship between time and distance.
In this experiment, the independent variable is time. The experimenter CHOOSES to select the time when the measurements will be made; so in some sense the experimenter is controlling time. They could do this by filming the rock falling, for example, and only examining every 60th picture so that information is gathered for each second, ignoring the other 59 pictures made along the way.
Therefore the dependent variable is distance. The experimenter measures this as a result of the time he or she chose to observe.
There are any number of interfering variables such as air resistance, the shape of the rock, and where the experiment is conducted (on earth or some other planet). These things must be eliminated by using a heavy rock, using a smooth symmetrical rock (not lumpy) and doing the experiment in the same place.
To see some sample data and graphs for such an experiment, click here.
To see the equation for an object which falls and how to analyze it, click here.
Connections
Once you have your results, it's traditional to graph them (if numbers) or display them in a table (if words). Traditionally, you present a data table with the independent and dependent data, and a graph with the independent variable on the x-axis and the dependent variable on the y-axis. These topics are covered elsewhere on this page. Once you have a graph, you can analyze it to see if there is a specific relationship between the two variables. If you're lucky you can even infer or derive an equation which allows you to make further predictions.
Advanced tips
Here are a few tips for designing your own experiments:
• More data is always better. Not only should you have several different values for the independent variable, you should repeat each one several times. Accuracy of experimental results is an entire topic unto itself.
• If you want to find out the effect of changing more than one variable at a time, you can do a series of experiments called a multi-dimensional experiment where you do one whole experiment by changing the independent variable, then do another experiment by changing a different independent variable, and so on. Often 3-d graphs are used to display such results.
• A variable is a thing that can be measured, not a thing. Think of a variable as an adjective, not a noun. So don't list "car" as the independent variable; list "speed of the car", or "weight of the car" or "color of the car" or "year of manufacture".
Graph Analysis
This section is not intended as a replacement for learning how to make a graph. Rather, its function is to show how to analyze a graph you have already made to find out what kind of relationship exists in it.
By tradition, when you have completed an experiment, you typically plot the results on a grid with the independent variable on the x-axis, and the dependent variable on the y-axis.
A good graph has what is being measured written on each axis, along with the unit of measurement. In the language of experimental design, this is called a "Dependent versus Independent" graph.
Any time you see the word "versus" describing a graph, the words before "versus" go on the y-axis, and the words after "versus" go on the x-axis. Incidentally, this is very difficult to control on a spreadsheet unless you set your columns up correctly: y is the left column, x is the right column, and use "X-Y Scatterplot" style graphing.
Also, the data is displayed in a table with the independent variable on the left column, and the dependent variable on the right. This is because the independent variable is changed first, and happens first, and so it comes before the dependent variable, which happens later.
Graph shapes
Many graphs have a similar shape, and can be classified according to how they appear. The classifications describe what the shape looks like, and also provide clues about the relationships between the variables involved.
In high school science (up to 12th grade), graphs almost always can fit into one of the following shape categories:
• linear
• radical
• inverse
Combinations of these shapes can occur. The most common is a combination of inverse and quadratic called "inverse-r-squared" for reasons better explained elsewhere. Advanced classes may see two other kinds of graphs:
• logarithmic/exponential
• sinusoidal
In this document we will concentrate mainly on the four basic shapes; and while such combinations as "linearly quadratic" and "radical inverse" exist, we will pursue only examples you're likely to see in introductory science classes.
What the graphs look like
Linear
Linear graphs are straight lines, such as this graph used to find the density of a rock: The graphs of linear functions are said to have direct relationships. This means that whatever change happens to x, a proportional change exactly the same scale happens to y.
In this example, what is the mass of a 2 cc rock sample?
Click here!
9 grams
What is the mass of a 4 cc rock sample?
Click here!
18 grams
So you can see, for a linear graph, choosing an x- value twice as large makes the y-value twice as large as well.
In this experimental design, the experimenter changed the mass of the sample being looked at, and measured the resulting volume. Thus mass is independent, and volume is dependent.
Inverse
Inverse graphs are characterized by a "downhill slope" appearance because they represent relationships that make one thing larger as another thing gets smaller. In this example, a person drives the same trip over and over at various speeds. The person discovers, naturally enough, if you drive faster, it takes less time to get to your destination.
In an inverse graph, you can see that larger values of x lead to smaller values of y. In fact, going twice as fast should get you there in half the time. Compare 35 miles per hour to 70 miles per hour. At 35 miles per hour it takes about 1.45 hours to make the trip (50 miles in this case). At 70 miles per hour it takes about 0.73 hours, or half the amount of time.
In this experimental design, the speed was changed by the experimenter (so it is independent) resulting in different times for the trip (so time is dependent).
Quadratic
Quadratic relationships happen when one variable is quadratically related to another. This occurs when one of the variables is squared to obtain the other variable. In this example, the diameter of a pizza is compared to the area of the pizza.
Look at the area of a pizza which is 6 inches in diameter. About how much is it?
Click here!
About 28 square inches.
Now look at the area for a pizza with twice the diameter , or 12 inches. How much area does it have?
Click here!
About 113 square inches, which is 4 times larger.
So in a quadratic relationship, doubling the x-axis value causes the other value to increase four times. For more information about how quadratic relationships work, click here.
Radical
In a radical graph, the shape appears to go uphill at first, but then gradually flattens out. In this example, the time needed for a rock to fall a specified distance is measured.
In these relationships we find the dependent variable (time in this case) by taking the square root of the independent variable (distance fallen). (There are other factors involved; for an analysis of the equation that generates this graph, click here.) In other words, time is a function of the square root of distance in this example.
![]()
In these kind of relationships, it is often more convenient to swap the x- and y- axes and rewrite the relationship as a variation of a quadratic relationship. You can see by looking at this graph if we swap the axes we get a graph that looks like this:
Which is the graph for the equation
![]()
which has a quadratic relationship. So radical graphs are the same as quadratic graphs with the axes flipped. This is a graphical way of saying the mathematical rule:
To get rid of a square root in an equation all you do is square both sides.
Inversely Quadratic or Inverse-r-squared graphs.
Inverse-r-squared graphs refer to an important category of phenomena such as the strength of the force of gravity, the brightness of light, and other effects, which obey a relationship which is inverse at the same time it is quadratic. For more information about the mathematical relationship, click here.
Inverse-r-squared graphs look like inverse graphs, but they just "scoop out deeper." as shown here.
As with gravity, for example, the farther away you get the weaker the effect gets. If the relationship is inverse, if you get twice as far away, the effect is half as strong; but with inversely quadratic, if you get twice as far away, the effect is only one-quarter as strong. Click here for an example of an equation that behaves this way.
Shared Example for Graphs
Here is a data table a student used in an experiment about a falling object:
time (sec)
distance (m)
0
0
1
5
2
20
3
45
4
80
5
125
In this experiment time was independent (the experimenter decided how long to let the rock fall) and distance was dependent (the experimenter observed the distance the rock falls as a result.)
The graph the student generated from this data looks like this:
This graph has a
Click here!
Quadratic
shape.
To learn about the experimental design used to get this data, click here.
To learn about the equation that describes this data, click here.
Common Errors in Graphing
Students sometimes just copy the data onto the axes like this:
• This doesn't work because the y-axis values are not equally spaced. There should be the same size gap between each tick mark on the side of the graph, as in 40,80,120,160,200,240,280 as opposed to 0,40,10,275,276 as shown here. This type of error always causes the graph to come out to be a line and you cannot tell anything about its shape or the relationships from such a plot.
• Sometimes students swap the x and y axes, which can lead to errors in classifying the graphs's shape. (See the radical example above).
• Students often do not label the axes with the proper units or even tell what the graph is attempting to display.
• Students should mark each data point with an x and draw the best-fit line through as many x's as possible.
• If a range of measurements exists for a particular value of the independent variable, the student should plot the maximum and minimum using an i-bar and plot the mean value with an X as shown here. The red x's represent the mean or average value. This actually gets a lot more complicated in more advanced classes; the I-bar is supposed to represent your confidence that the correct answer lies near your average.
Connections
To get numbers for your graph, you'll have to do an experiment to obtain the data. Once you have a graph, you can analyze it to see if there is a specific relationship between the two variables. If you're lucky you can even infer or derive an equation which allows you to make further predictions.
Equation Analysis
The analysis of equations can save you tremendous amounts of time and effort. With relatively little effort, you can learn to read an equation in much the same way as you read a sentence. Then you will get more meaning from the equation than just a series of letters strung out in a row.
Learning to analyze an equation is a lot like learning to read for the first time. Let's go through an example to see why.
Consider the equation. Read it aloud.
F = ma
Stage One : Learning your letters (preschool)
When asked to read this equation, most students will say: " F equals M . A. " Everyone understands that this means to write the equation down in the standard way. There's no harm in that; however, it does not lend much understanding regarding what the letters mean.
Stage Two: Letters stand for other things (Kindergarten)
These four symbols actually convey a lot more information than that. Ignoring the vectors involved for advanced physics, let's just say F stands for force, m stands for mass, and 'a' stands for acceleration. With that in hand, now we can read the equation as:
"Force equal sign mass acceleration."
Which is at least better than unidentifable letters.
Stage Three: A sentence is more than the sum of its parts (Elementary School)
Eventually readers learn that aside from being labels for things, sentences describe ideas, thoughts, situations, conditions, and so on. So when a sentence like "See Spot Run," for example, is read, an image of a dog running along the ground is formed. This has more meaning than knowing just that Spot is a dog, and running means going fast. In the same way, equations give instruction about what to do with the terms inside and how they work together just like "Spot" and "running" work together to make a mental image.
Equals signs, obviously, mean that the things on the left are the same as the things on the right. Two letters written side by side without a symbol means they are multiplied together. Now we can get some meaning out of the sentence by interpreting it as:
"Force equals mass multiplied by acceleration"
Which at least tells us what to do with the numbers once we have them. Most students, entering high school, can interpret most equations like this although they may have some difficulty with the order of operations or interpreting special symbols such as sin(x) or 103. However, that's not the whole story.
Stage Four: Learn to read for meaning and purpose. (High School)
An advanced reader will feel, well, unsatisfied with "See Spot Run." It's simplistic and doesn't tell you the important things like "Why does Spot Run?" and "Where is Spot Going?" and "Where is Spot's Owner?" In other words, using your imagination and prior knowledge (such as material you've already read) you can read, or imagine, an entire story about Spot:
Jan and Rayce decided to go to the park to play. They took along their Frisbee and some dog treats, and of course, their dog Spot. Each time they'd throw the frisbee, Spot would run and catch it in return for a dog treat. Once Jan threw the frisbee over a fence by accident. Spot accelerated to jump the fence. "See Spot run!" cried Rayce.
In the same way, a mathematical equation, especially in science, can have an entire history of information behind it. F = ma is a summary of many important ideas, which, when stated simply, reads:
"The net force on an object is equal to the product of its mass and its instantaneous acceleration. Objects accelerate in the direction of the net force acting on them."
Which can be "expanded" to mean (with some small loss of technical information about the direction of the force and acceleration):
Force and mass are directly related when acceleration is constant.
Force and acceleration are directly related when mass is constant.
Mass and acceleration are inversely related when force is constant.
Which, in layman's terms, means:
1. You have to push a big object harder to make it move the same way as a smaller object.
2. If you push an object harder, it will pick up more speed in the same time.
3. If you push a larger object with the same force as a smaller object, the smaller object will go faster in the same time.
Decompressing Equations
How can all of THAT be built into just four symbols? "F=ma". That's a lot of information for just four symbols.
This is how. Through the skill of "Equation Analysis" nearly any equation can be broken up into the various relationships that make it up. Best of all, there are only five rules for doing so. (At least at first.)
Rule #1.
If two variables appear on opposite sides of an equals sign, and neither is being acted on by another function (like being squared, taking the square root, or being divided into something else), then the variables have a direct relationship.
In a direct relationship, changing one variable causes the other one to change by the same factor.
For example, if you work twice as many hours, you make twice as much money.
Rule #2.
If two variables appear on the SAME side of an equals sign, and they are simply multiplied together; OR if they appear on OPPOSITE sides of the equal sign and one of them is in the denominator of a fraction, they have an INVERSE relationship.
In an inverse relationship, changing one variable causes the other one to change by one over the same factor (the mathematical inverse).
For example, if you drove a certain distance twice as fast, it only takes half the time. Three times as fast is one third the time, and four times as fast is one fourth the amount of time, and so on.
Rule #3:
If two variables are on opposite sides of the equals sign, and one of them is squared, it is said to have a quadratic relationship with the other.
In a quadratic relationship, doubling the squared variable (B is squared here) will cause the other variable to quadruple. Tripling the squared variable causes the other variable to increase by a factor of 9, and so on according to the following table:
Factor by which B changes
Effect on A
2 x larger
4 x larger
3 x larger
9 x larger
4 x larger
16 x larger
5 x larger
25 x larger
6 x larger
36 x larger
...and so on
For example, the stopping distance needed by a car is quadratically related to the speed of the car. That means, a car travelling at 90 miles per hour will require 9 times farther to stop than a car traveling at 30 miles per hour!
Corollary to Rule #3: what about the other way around?
In this example above, A has a Quadratic relationship to B. However, B does not have a quadratic relationship to A! This is because doubling B will cause A to quadruple (a quadratic relationship), but doubling A does not cause B to quadruple. Instead, they B has a radical relationship to A, which can be seen by taking the square root of both sides of this equation. This is called a radical relationship.
If A quadruples, A is only twice as large.
Rule #4: Relationships can combine and happen at the same time. If, for example, a variable appears on the opposite side of the equals sign, in the denominator of a fraction (making it inverse) and is squared (making it quadratic), the relationship is called inversely quadratic, or more traditionally, inverse-r-squared.
For example, the moon is 60 times farther away from the center of the earth than you are. Gravity behaves as an inverse r squared force; so at the distance of the moon, the earth's gravity is only 1/3600 times as much. Inverse r squared forces behave according to the following table:
Times farther away
Factor that force changes
1
1
2
1/4
3
1/9
4
1/16
5
1/25
and so on
Why is it called an inverse-r-squared force? r stands for the radius of a circle, and gravity, light, and other inverse-r-squared phenomena radiate out in a spherical pattern. So r is just how far you are away from the source. It could just as easily be "d" for distance.
Rule #5:
Equation analysis is simpler if the equation is simplified. Therefore, get rid of radicals by squaring both sides; get rid of denominators by multiplying both sides of the equation by the denominator. That effectively reduces most relationships to just three types: direct, inverse, and quadratic.
Along with classifying the types of relationships, you can also make predictions about what the graphs will look like, and what effect changing one variable (as an independent variable) has on the other variable (as a dependent variable).
Consider the following example.
Suppose you're driving a car from Antioch to Concord. While driving 60 miles per hour, the approximately 20 mile trip takes a certain amount of time. If you drove thirty miles per hour, how many times longer or shorter would the trip take?
The hard way
The most direct way to solve such a problem would be to work it twice and compare the two answers. So here goes:
First trip: time = distance / speed, so time = 20 miles / 60 mph , which is 0.33 hours or 20 minutes.
Second trip: time = distance /speed, so time = 20 miles / 30 mph, which is 0.66 hours or 40 minutes.
Comparing 40 minutes to 20 minutes we see the trip takes twice as long.
The easy way
A better way to solve such a problem is to identify the relationships in the equation and ask what effect is implied. for time = distance / speed, time and speed have an inverse relationship. Having an inverse relationship means that as one variable gets larger, the other gets smaller by the same factor; so halving (multiplying by 1/2) the speed will cause the time to increase by a factor of 2. So the answer is "twice as long".
Example 2:
Suppose you're doing an experiment to determine how the period (time to swing back and forth once) of a pendulum is affected by the length of the pendulum's "string" (assuming a small, compact pendulum bob a the end of a relatively long string in a frictionless environment) you would find something like the following:
Length (cm)
Period (sec)
0
0
10
0.63
20
0.90
30
1.10
40
1.27
50
1.42
60
1.55
70
1.68
80
1.80
90
1.90
100
2.01
A quick examination of the data doesn't reveal anything obvious other than as the length gets longer, the period gets longer (which makes sense). However, if you graphed the data, you'd see something more interesting:
This is a radical graph, which implies that the period of the pendulum is related to the
Click here!
Square root
of the length of the string.
That means, without further calculation or analysis, if a pendlum string is nine times longer than another, the time it takes to swing back and forth once will be
Click here!
three times because the square root of 9 is three
times as long.
Other rules
• Don't analyze constants such as g, 1/2, or operators such as +/-, cos, sin, or the square root symbol.
• Beware of two-letter variables (nonstandard for professional scientists) such as KE (kinetic energy) or PE (potential energy). These are just one variable. K does not have an inverse relationship to E for example.
Shared Example for Equations
Consider the equation d = 1/2gt2. In this equation, distance and time are the only variables; the other symbols are constants.
What is the relationship between distance and time in this equation?
Click here!
Quadratic
This means that if an object falls three times as long, it will fall
Click here!
Nine Times because 3 squared (quadratic) is 9.
as far.
To find out how an experiment using these variables could be set up, click here.
To find out how the graph for this example would appear, click here.
Going Further
For advanced students, consider constructing the graph shapes and proportion rules for other functions not described here such as:
Sinusoidal ( y = sin(x), y = cos (x))
Exponential (y = Ax)
Logarithmic ( y = log x, y = ln x)
...and what other functions could be added to this list?
Master Summary
Kind of Relationship
Example equation
Shape of graph
Experimental Design
Real World Example
Effect of doubling independent variable
Effect of tripling independent variable
Effect of cutting independent variable in half
Direct
A = BC
A and B are direct.
Linear
Let B be independent, and A is dependent. C is interfering.
Dollars Earned = hours worked x hourly rate.
Dollars and hours are direct.
Dependent variable doubles
Twice the hours-> twice the money
Dependent variable triples
Three times the hours-> three times the money
Dependent variable gets cut in half
Half the hours -> half the money
Inverse
A = BC
B and C are inverse.
Inverse
Let B be independent and C be dependent. A is interfering.
If you travel a fixed distance at various speeds, using Distance = Speed x time, speed and time are inversely related.
Dependent variable gets cut in half
Twice the speed -> half the time
Dependent variable cut to 1/3 of original value
Triple the speed -> one third the time
Dependent variable doubles
Half the speed -> twice the time
Quadratic
A = B2
A is quadratically related to B, but B is not quadratically related to A
Quadratic
Let B be independent and A be independent. Any other variable is interfering.
Stopping distance = a constant times your speed squared.
Dependent variable quadruples.
Twice the speed-> four times the stopping distance
Dependent variable gets 9 x bigger
Three times the speed -> 9 x the stopping distance
Dependent variable gets 4 times SMALLER.
Half the speed ->you can stop in 1/4 the distance
Radical
B = Square Root of (A)
B is radically related to A, but A is not radically related to B.
Radical
Let A be independent and B be dependent.
Time for a pendulum to swing = the square root of its length times some constants.
Dependent variable gets square root of 2 times larger.
Dependent variable gets square root of 3 times larger.
Dependent variable gets square root of 1/2 (which is .707) times as large.
Inversely Quadratic or Inverse-r-squared
A = 1/B2
Inversely Quadratic
Let B be independent and A be dependent.
The brightness of a light bulb is inversely and quadratically related to your distance from it (if the bulb is small.)
Dependent variable gets 4 times smaller.
Dependent variable gets 9 times smaller.
Dependent variable gets 4 times bigger.
Glossary
Cause -- A change in condition which makes another change happen as a result. The independent variable is a cause if it makes the dependent variable of an experiment change.
Dependent Variable - The variable you observe in an experiment. The result or the effect of the cause.
Dimensional Analysis - The practice of combining and simplifying units of measurement using the rules of Algebra. For example, mph times by hours yields miles.
Direct - Kind of simple relationship where changing one variable makes the same exact proportional change in another. In an equation, the variables are on opposite sides of the equals sign.
Double-blind experiment - Kind of experimenter where the experimenter doesn't know who is getting the treatment (independent variable settings) until after the experiment is over, to remove prejudice and unconscious skewing of the results.
Effect - Result of the change made in the independent variable. Where there's a cause, there's an effect. Another name for dependent variable.
Experiment - A test of a hypothesis to see if it is true or false. Involves changing an independent variable to see its effect on a dependent variable while holding interfering variables constant.
Experimental Variable - Another name for independent variable.
Fact - An observation agreed to be accurate by the majority of relevant experts in the field.
Horizontal axis - the x-axis, or the variable that goes on the sideways axis off to the right of the origin.
Inverse - A kind of relationship which has a downhill, sloped graph that starts steep and ends flat. In an inverse relationship changing one variable has the exact same proportional change on the other, except the change is inverse (1/x).
Inversely Quadratic - A kind of relationship which has a downhill, sloped graph steeper and deeper than an inverse grave. In this kind of relationship changing the independent variable causes the dependent variable to decrease by a factor of 1/x2.
Independent variable - The thing you change in an experiment. You control it or choose it. Sometimes called the cause or the experimental variable or the treatment.
Interfering variable - Variables which could be independent, could cause the effect, but you don't want them to; so you keep them constant so they won't interfere.
Law, Natural - A very old, and trusted theory.
Linear - A straight line graph. Direct relationships have this kind of graph.
Multi-Dimensional Experiment - A series of experiments with more than one independent variable, conducted independently, and summarized later.
Natural Law - A very old, and trusted theory.
Hypothesis - A testable educated guess; a building block of scientific theories. The structure of a hypothesis is: I predict that changing the independent variable will have this effect on the dependent variable.
Quadratic - A kind of relationship with a graph that starts out flat, but rapidly tilts uphill in a parabolic pattern. In a quadratic relationship, changing the squared variable causes the unsquared variable to increase quadratically. In a quadratic equation, one variable is squared, and the other is on the opposite side of the equals sign.
Radical - A kind of graph and a kind of relationship. The graph starts uphill steeply, then flattens out. The relationship is characterized by having one variable under a radical sign (square root) and the other on the opposite side of the equals sign.
Random Error - Uncontrolled error caused by natural effects of the inaccuracy of measurement (NOT by careless measurement). The only cure for truly random error is LOTS of data.
Theory - Theories do three things. They explain the results of past experiments. They predict the outcome of future experiments (and thereby are a source of hypotheses). The must also not contradict other well-understood laws and theories.
Treatment - Usually in the biological or behavioral sciences, another term for independent variable.
Unit of measurement -an agreed upon standard for measuring, such as feet, seconds, grams, m/s, and so on.
Vertical axis -the y axis, where the dependent variable is usually plotted.
Variable - a thing which can be measured and can change. Not a noun, but an adjective.
Updated November 2002
Jeff Adkins
Please send email feedback to this address: jeffadkins@antioch.k12.ca.us
Copyright 2002 Jeff Adkins/Adaptive Consulting. Permission is granted for any Deer Valley HS student to print and save this file for educational purposes. Please contact me for permission to publish in other venues.